
You have 10 Minutes with the Board to explain Cyber-Risk.
You’re presenting to the board — you have ten minutes, maybe less. You’ve got time for four or five bullet points, a few slides, and one chance to make it resonate. How do you communicate risk in a way that grabs their attention and drives real understanding? The answer: present risk in business language, not security language, and a heat map is an ideal way.
🎯 Translate Risk into Business Context
When I present cybersecurity risk to the executive team and board, I focus on translating complex technical issues into a business and financial context that they can act upon.
I developed a high-level risk heat map that visually overlays applications and infrastructure based on the enterprise risk matrix. Each system is color-coded by likelihood and impact of exploitation, helping non-technical stakeholders immediately see where risk exists, enabling them to ask the right questions, such as, “Why is this application showing as orange?”
🔍 A Risk Matrix Supports the Heat Map
To drive decision-making, I convey risk through three simple lenses:
Nature of the threat
Probability of exploitation
Potential impact if realized
The risk matrix is analytical; the heat map is communicative. One quantifies risk — the other visualizes it, enabling leadership to take action.
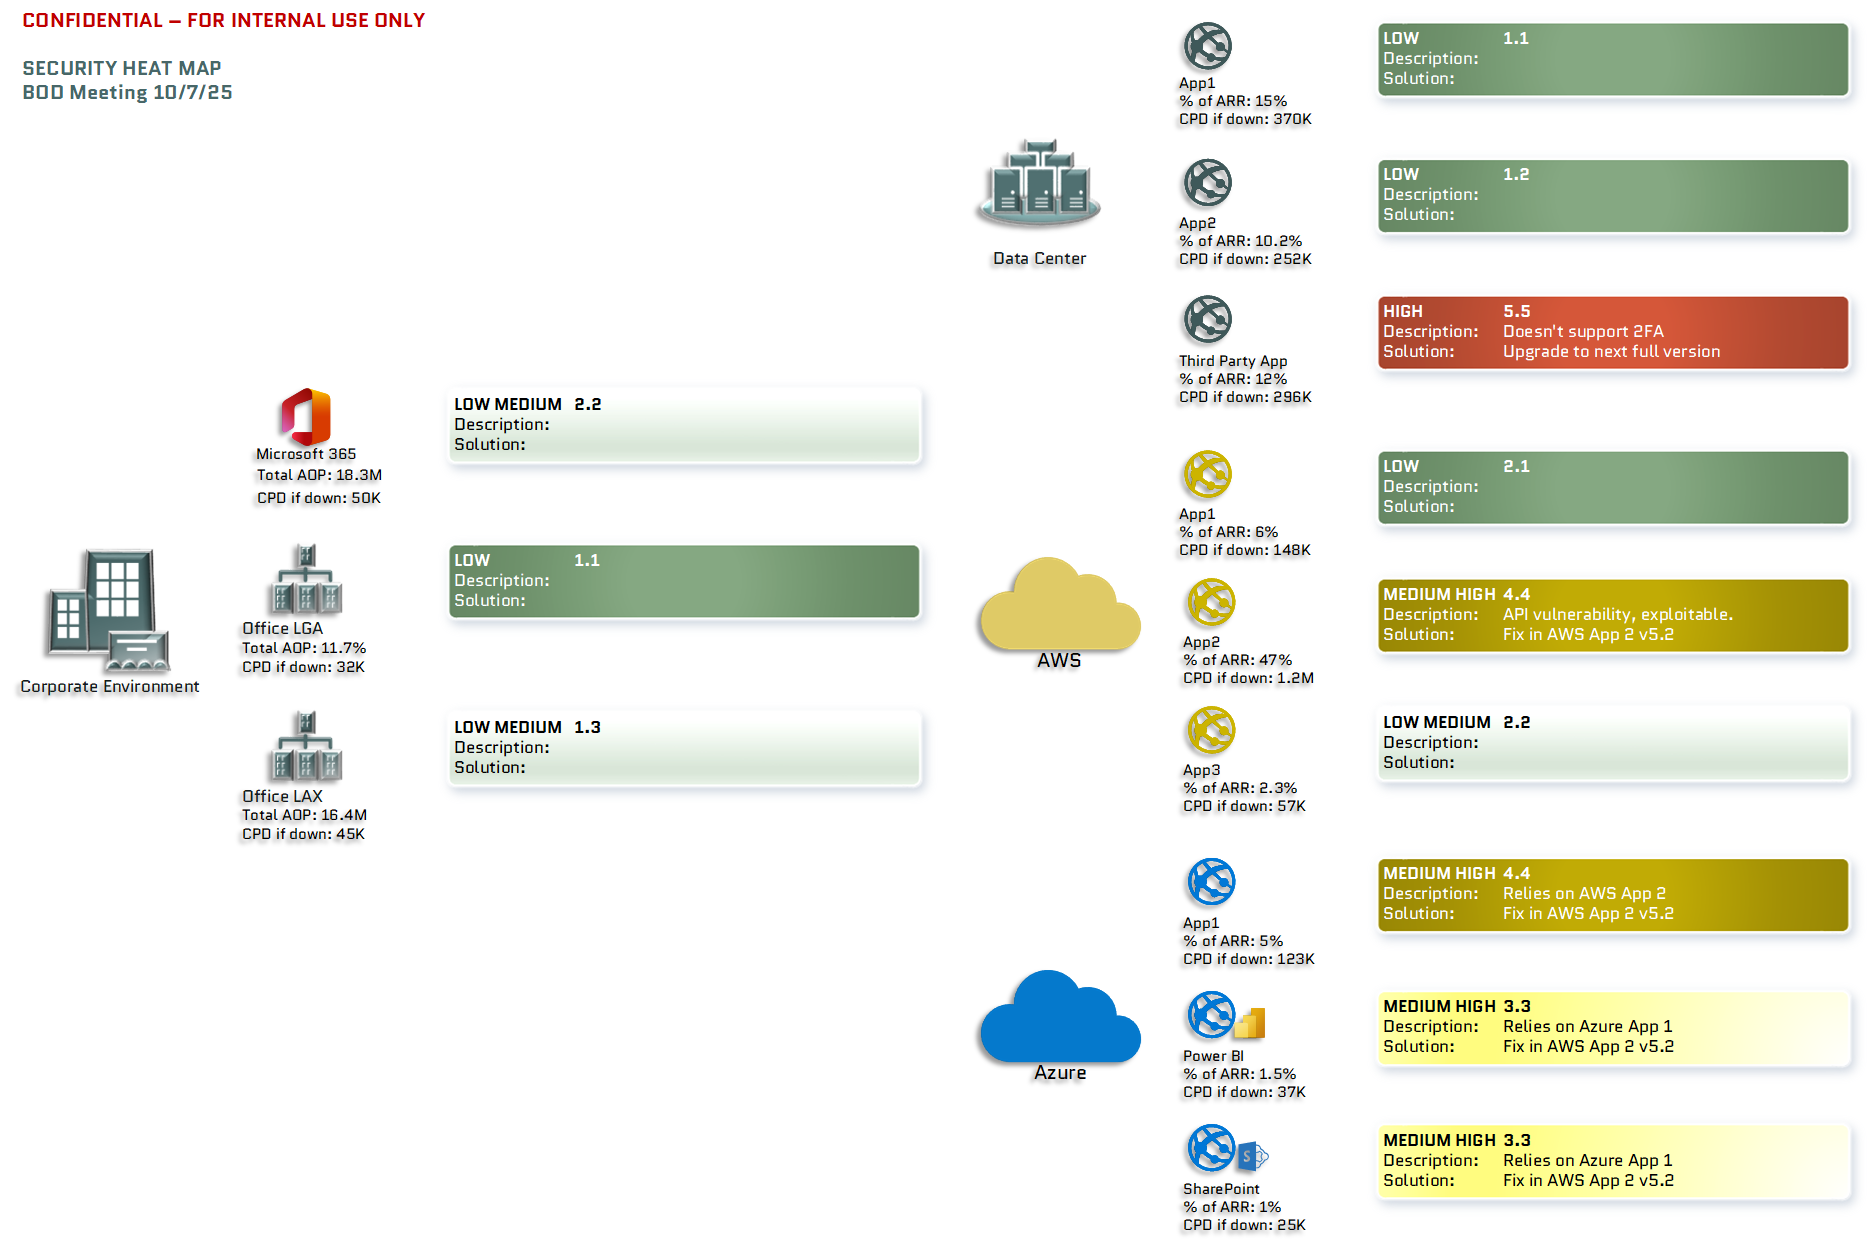
💡 What the Heat Map Shows
Neither a risk matrix nor a traditional security heat map, which is just another matrix, provides business context. What I'm talking about is a heat map that bridges the gap between security posture, financial impact, and operational impact.
The heat map view includes:
Environment at risk
Revenue-generating product, service, or platform
% of Annual Recurring Revenue (ARR) the asset generates
Cost per day (CPD) if it’s unavailable
One-line description of risk
One-line proposed solution
For internal systems that don’t generate revenue, I measure risk in terms of Annual Operating Expense (AOP) and CPD if down. As part of my discussion, I address productivity loss, regulatory reporting requirements, and reputational exposure — the universal metrics every board understands.
📊 From Visualization to Decision
A risk heat map helps leadership see risk, not just read about it. It allows them to understand intuitively which areas matter most. By connecting cybersecurity to operational and financial outcomes, it transforms abstract metrics into a prioritization roadmap — guiding investment, risk acceptance, and mitigation timelines. Notably, you can highlight the expanded risk to applications that rely on each other in the description, providing a comprehensive view of the risk.

Example: Heat map bridging the gap between security, finance, and operations.
For presentation purposes, a more graphical diagram can be used.
🤝 Building an Ongoing Dialogue
Another way to strengthen alignment between leadership and cybersecurity is through a Security Charter — a joint agreement between key stakeholders to review top risks quarterly. The heat map becomes the centerpiece of that conversation, helping the team focus on the issues that matter most each quarter.
🧭 The Takeaway
When cybersecurity is visualized through the lens of business context, executives understand it, making it tangible, and they take ownership of it. Cybersecurity risk is a business risk; taking this approach makes everyone a teammate, looking to win the game.
💬 What’s Your Approach?
How do you translate cyber risk into business terms for your leadership team?
I’d love to hear how others make the conversation meaningful in those ten crucial minutes.
About Me
I help fast-growing companies architect secure, scalable environments that align with business strategy. Whether you're preparing for acquisition, expanding into new markets, or just tired of hoping nothing goes wrong, I can help you build it right.
Let’s talk,
Kurt Smith